Official NSW & Queensland data · area levels clearly marked
Know the suburb before you sign
Recorded offence trends for Queensland and NSW suburbs, laid out plainly — so a lease or a contract comes with context, not worry.
Enter
Try “Parramatta”, “Fortitude Valley” or “4006”. 8186 suburbs and postcodes currently covered.
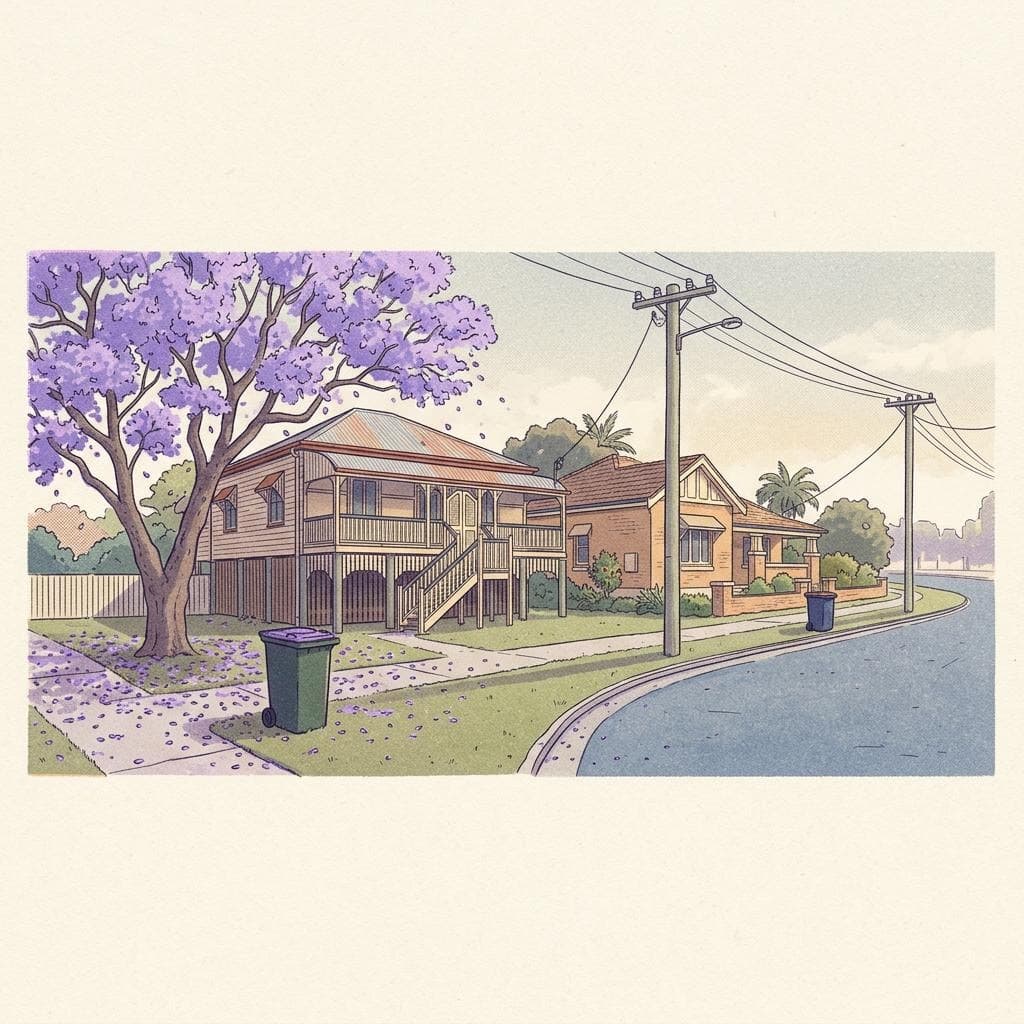
Explore with context
Whole-state NSW & QLD coverage. Actual data levels clearly labelled.
Popular suburbs
See allHow we read the numbers
Counts, rates and trends — nothing more dramatic than that.
Recorded, not total
Figures are offences recorded by police. Some incidents are never reported, and reporting habits differ between places.
Rates for fairness
Busy town centres attract visitors, so counts run high. Where population is known we show a rate per 1,000 residents.
Trends over headlines
Monthly history shows whether things are steady, easing or rising. NSW has a five-year view; QLD shows available export coverage and labels partial months.
Where the figures come from
SafeSuburb is built around open data from the Queensland Police Service and the NSW Bureau of Crime Statistics and Research, both published under a Creative Commons Attribution licence.
NSW figures come from official BOCSAR suburb data. Queensland prioritises QPS crime-map postcode exports; otherwise it shows official police-division trends and LGA context, clearly labelled. Area rates use matching area populations—not a smaller suburb's population. Check each page's data level, reporting period and refresh date.
Read the full methodology- QPS
- Queensland Police Service offence data
- BOCSAR
- NSW Bureau of Crime Statistics and Research
- 60 months
- Monthly history per suburb
- CC BY
- Open licence, attributed on every page